Risk & Volatility
Drawdown And What It Measures
Drawdown records the fall from a portfolio's previous peak, which captures the experience of holding an investment far better than measures of average variation do.
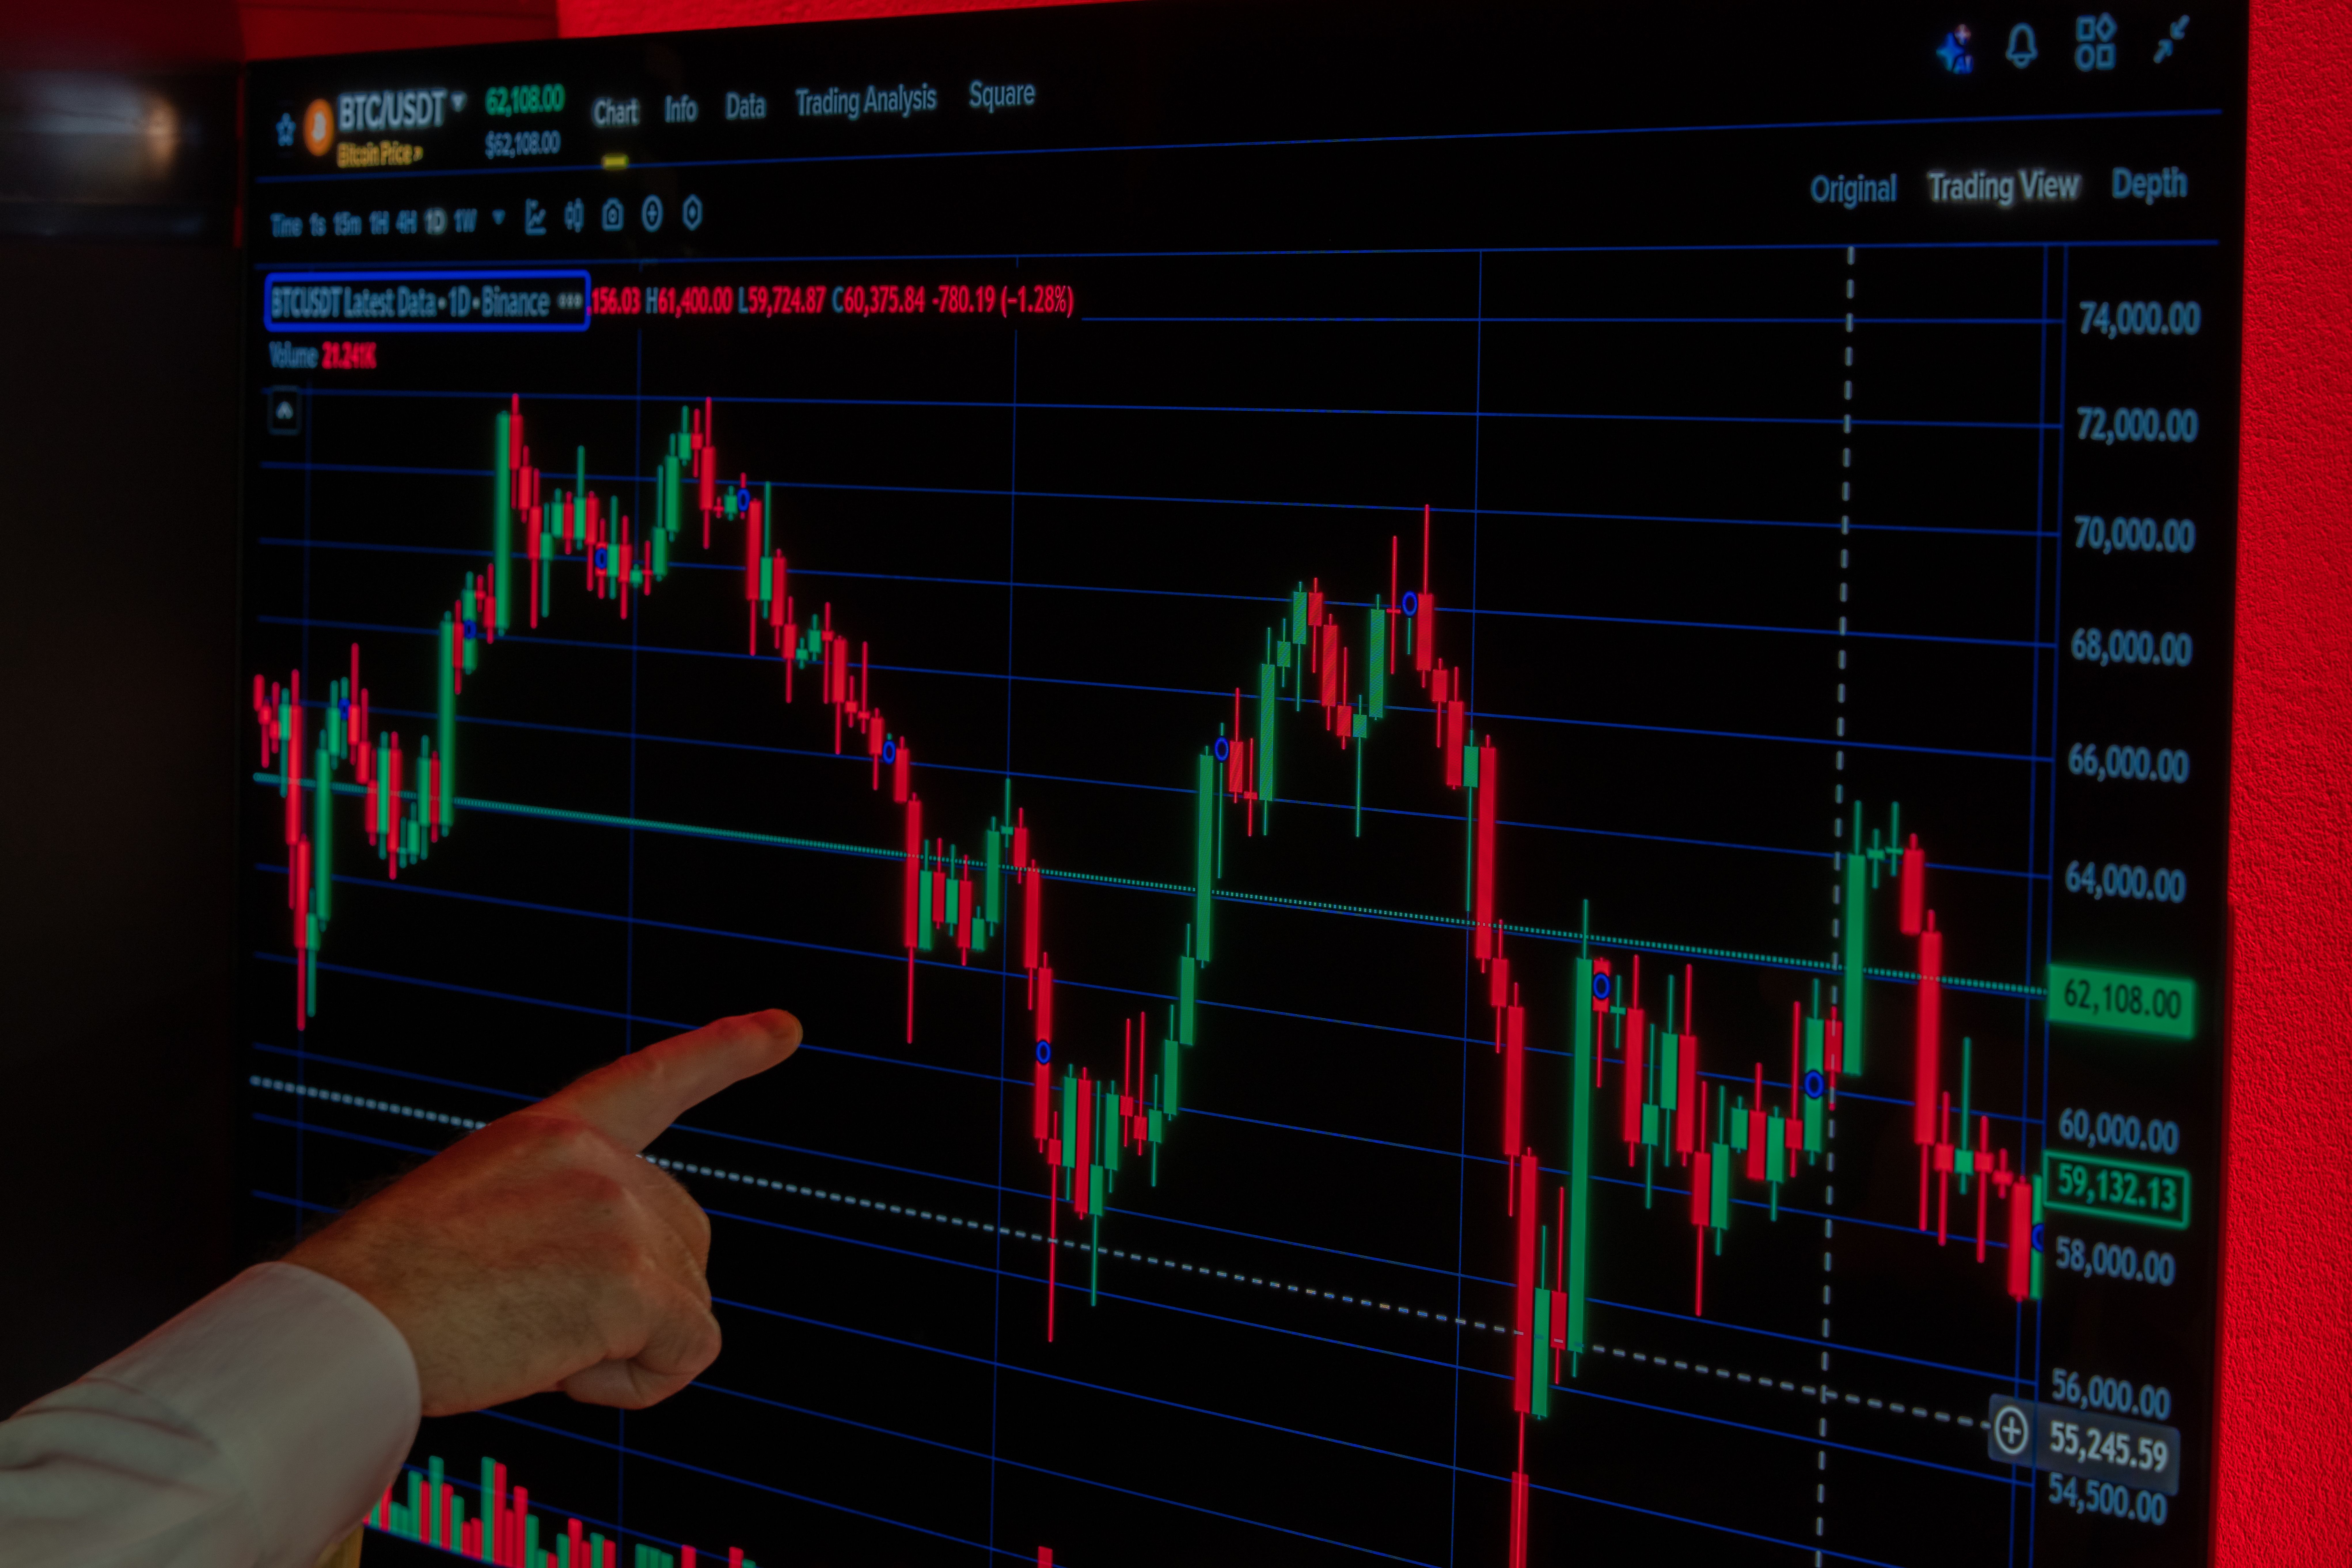
Drawdown measures the decline from a previous high point to a subsequent low. It is a different question from how much an investment fluctuates, and it maps more closely to experience.
The measure is peak to trough
Drawdown at any moment is the gap between the current value and the highest value previously reached. It is zero whenever a new high is set.
Maximum drawdown records the largest such gap over a period, describing the worst decline someone holding throughout would have endured.
Unlike measures of variation, it is asymmetric by construction. Upward movement never contributes to it, which is why it corresponds to how losses are actually felt.
Recovery time is a separate dimension
The depth of a fall and the time taken to return to the previous peak are different measurements, and the second is often the harder one to sit through.
A shallow decline lasting years can be more difficult than a sharp fall recovered quickly, even though the first looks milder by depth alone.
Reporting both figures gives a fuller description, since either on its own omits half of what the experience consisted of.
Volatility measures miss the shape
Standard measures of variation treat upward and downward movement identically and assume outcomes are distributed in a way that markets do not follow.
Two portfolios can report similar variation while having produced very different worst declines, depending on how the movement was distributed over time.
Drawdown captures the path rather than the dispersion, which is why it appears alongside variation measures rather than replacing them.
The measured figure depends on frequency
Drawdown calculated from monthly values will understate what daily values would show, because intra-month lows are invisible in monthly data.
Comparing figures therefore requires knowing the observation frequency behind each, or the comparison is not meaningful.
Longer histories also contain more opportunities for a severe decline, so a fund with a short record may simply not have encountered one yet.
Past figures do not bound future ones
The largest historical drawdown is a description of what has occurred rather than a limit on what can. A longer or different history would show different figures.
Using it as a planning input is reasonable as an illustration of magnitude, provided it is not treated as a worst case that cannot be exceeded.
Its most practical use is as a question asked in advance, namely whether a decline of that scale would force a change in behaviour or in plans.
Also by Nour Haddad
- Comparing two funds properlyFunds & ETFs
- What happens if a fund or platform failsFunds & ETFs
- Thematic and sector fundsFunds & ETFs
- Factor investing, explained honestlyFunds & ETFs