Risk & Volatility
Fat Tails And Why Extremes Cluster
Market returns produce extreme days far more often than a standard statistical model predicts, and those days arrive in clusters rather than being spread evenly.
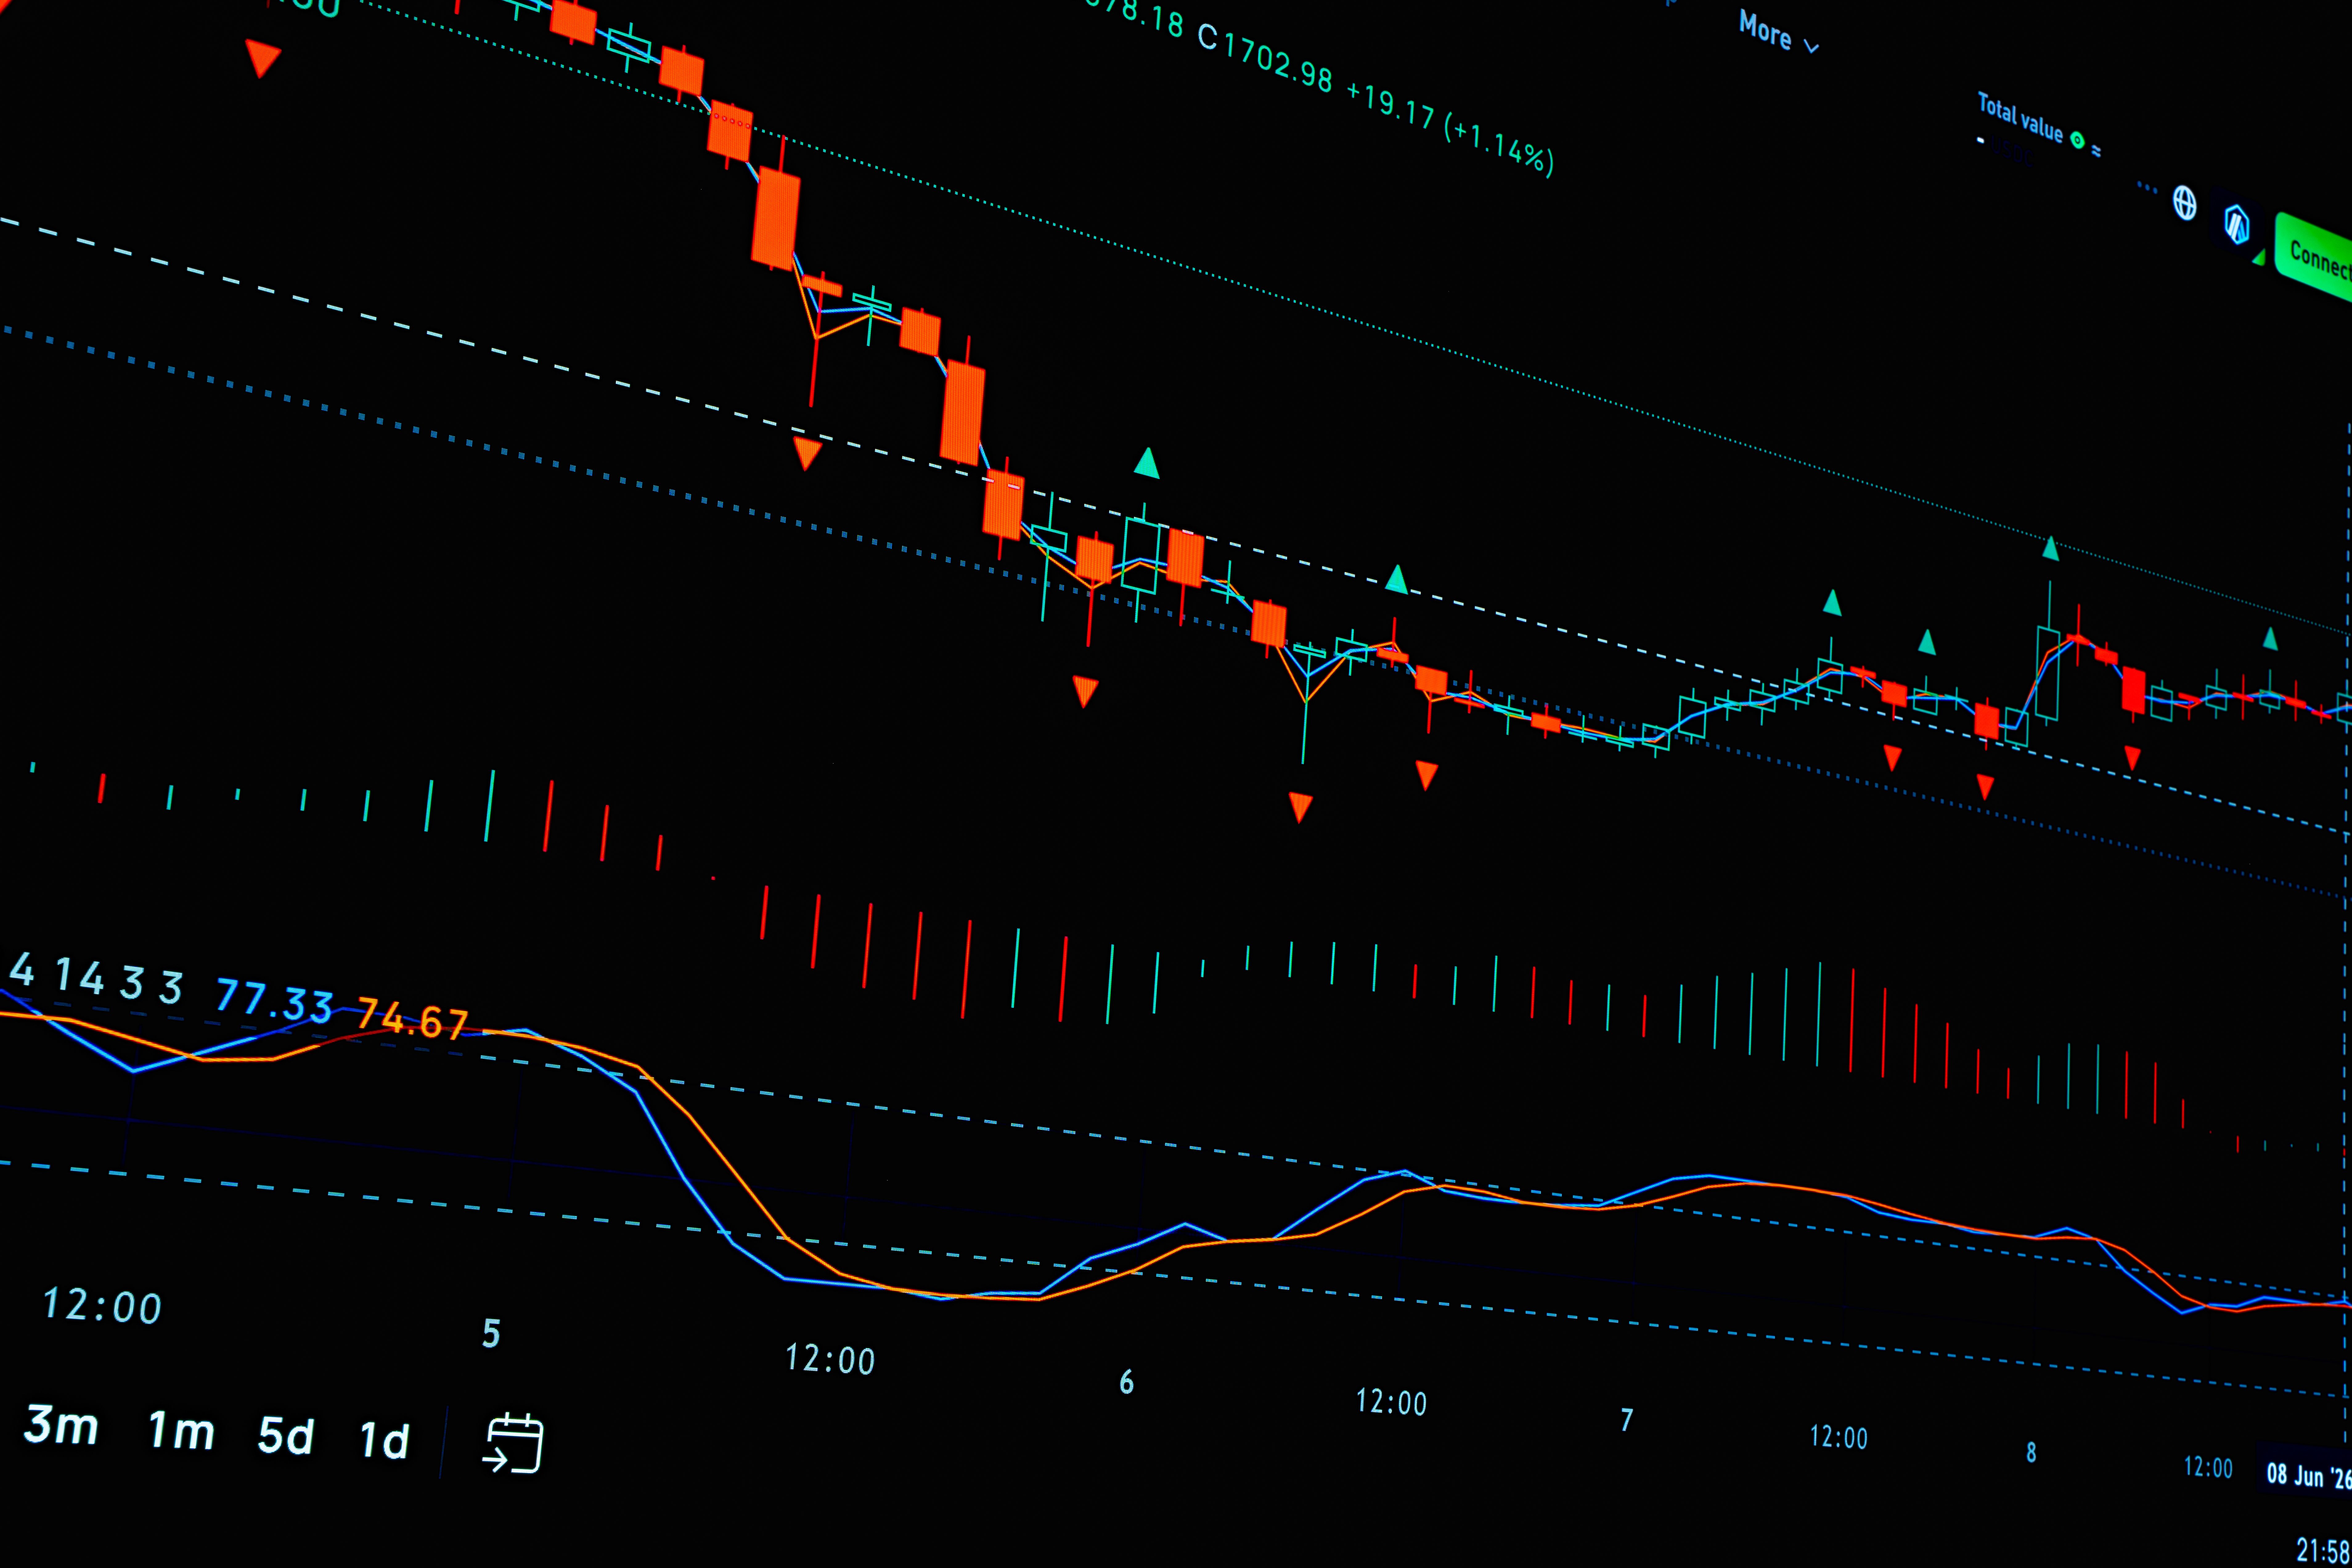
Financial models frequently assume returns follow a bell-shaped distribution. Actual market data departs from that assumption in two specific ways, and both matter for how risk is understood.
Extreme days occur too often
Under a normal distribution, movements of several standard deviations should be vanishingly rare, occurring less than once in many lifetimes.
Markets produce such days with far greater regularity, which means the model materially understates the frequency of severe outcomes.
This excess is what fat tails describes. The distribution has more weight in its extremes than the standard assumption allows for.
Volatility arrives in clusters
Large movements are followed by further large movements more often than chance would suggest, and quiet periods likewise tend to persist.
This clustering means calm conditions are not evidence that conditions will remain calm, only that they have been calm recently.
Risk measures calculated from a recent quiet period will therefore be low at precisely the moments when the potential for a shift is not reflected in the data.
Feedback explains part of it
Falling prices trigger margin calls, redemptions and risk limits, each of which produces selling that is not driven by any view about value.
That selling pushes prices lower and triggers further mechanical responses, producing a self-reinforcing sequence over short periods.
Because the mechanisms respond to price movement itself, they operate independently of whatever news started the move. The initial cause becomes irrelevant once the sequence is running.
The same feedback works in reverse when positions are rebuilt, which is part of why sharp recoveries frequently follow sharp declines rather than a gradual return.
A few days dominate long-run outcomes
A large share of the total movement over long periods is concentrated in a small number of days, in both directions.
The best and worst days also cluster near each other, since both occur during volatile periods, which complicates any attempt to avoid one while capturing the other.
This is why the arithmetic of missing a handful of days is so striking, and why it applies to the worst days as readily as the best.
Models need to be read with their assumptions
Risk figures produced by standard models are useful as summaries provided the assumptions behind them are stated and understood.
Approaches using historical data or deliberately stressed scenarios address the problem differently, though each has its own limitations regarding what history contains.
Treating any single figure as a boundary on possible outcomes is the error the tails describe, whichever method produced the figure.
Also by Nour Haddad
- Comparing two funds properlyFunds & ETFs
- What happens if a fund or platform failsFunds & ETFs
- Thematic and sector fundsFunds & ETFs
- Factor investing, explained honestlyFunds & ETFs