Risk & Volatility
What The Volatility Index Actually Measures
The widely quoted fear gauge is derived from options prices and describes expected movement over the coming month, which is a forecast rather than a reading of current conditions.
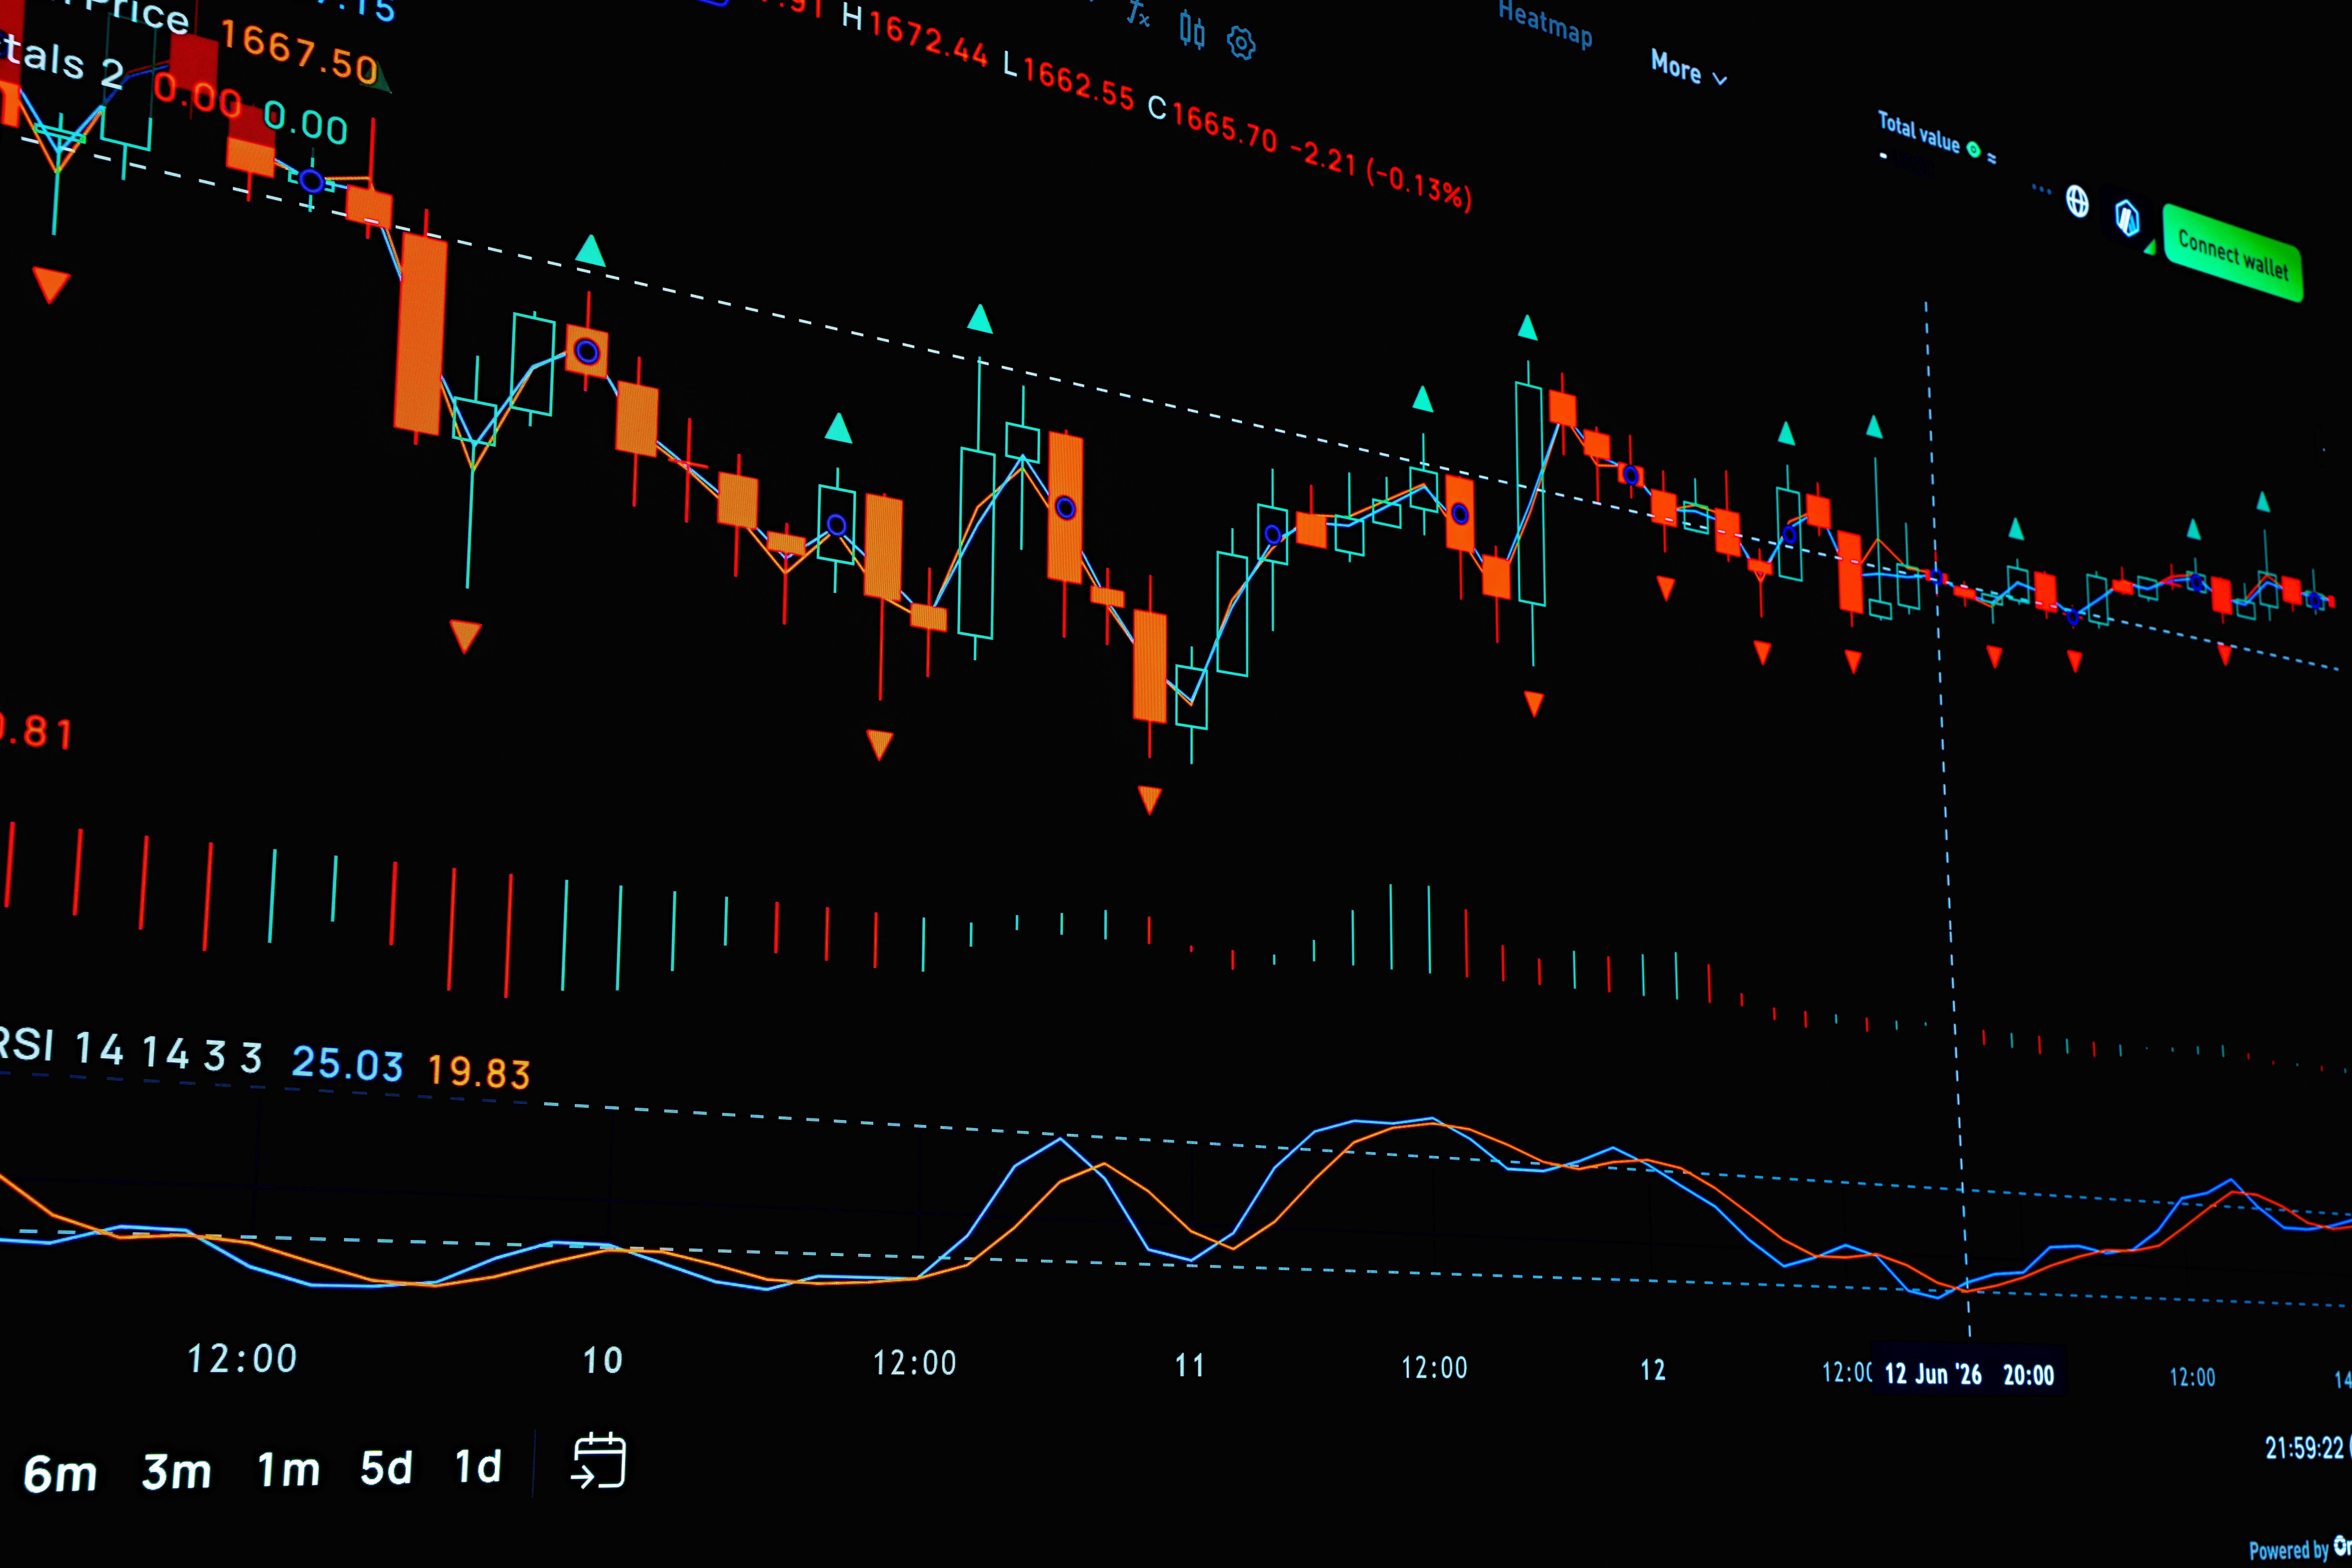
A single index is routinely cited as the market's fear gauge. What it measures is narrower and stranger than that description implies, and the difference matters for interpreting it.
Where the number comes from
The index is calculated from the prices of options on a broad American equity index, across a range of strike prices and near-term expirations.
Options prices embed an assumption about how much the underlying index will move before expiration, and the calculation extracts that assumption.
The result is expressed as an annualized figure describing expected movement over roughly the following month, which is why it is described as forward looking.
Expectation is not prediction of direction
The index says nothing about which way prices are expected to move. It describes the expected size of movement, in either direction.
It nonetheless rises overwhelmingly during declines, because demand for downside protection increases when prices fall and that demand raises option prices.
The association with fear therefore comes from the behavior of protection buyers rather than from anything directional in the calculation itself.
The risk premium embedded in it
Comparisons of the index against subsequently realized movement generally find that expected volatility exceeds what actually occurs more often than not.
The gap represents compensation earned by those who sell protection, which is a return for bearing the risk of a sharp move.
That structural feature means the index is not a neutral forecast. It is a market price containing both an expectation and a premium.
Why it cannot be held
The index is a calculation, not a portfolio, so exposure to it requires futures or products built on those futures.
Those instruments track the futures curve rather than the index itself, and rolling between contracts introduces costs and behavior unlike the published figure.
Long-run charts of such products consequently look very different from long-run charts of the index, which is a structural consequence rather than a defect in any particular product.
Reading the level in context
Low readings indicate the market is pricing modest movement, which is a statement about expectations and not an assurance that conditions will remain calm.
Sustained low readings have historically preceded both continued calm and abrupt reversals, so the level alone carries limited information about what follows.
The methodology, calculation and historical series are published by the index provider, which is the authoritative source for how the figure is constructed.
Also by Nour Haddad
- Comparing two funds properlyFunds & ETFs
- What happens if a fund or platform failsFunds & ETFs
- Thematic and sector fundsFunds & ETFs
- Factor investing, explained honestlyFunds & ETFs