Risk & Volatility
Why Average Returns Describe Almost No Year
Long-run average returns are arithmetic summaries of a wide spread of outcomes, and individual years cluster far from the average more often than they land near it.
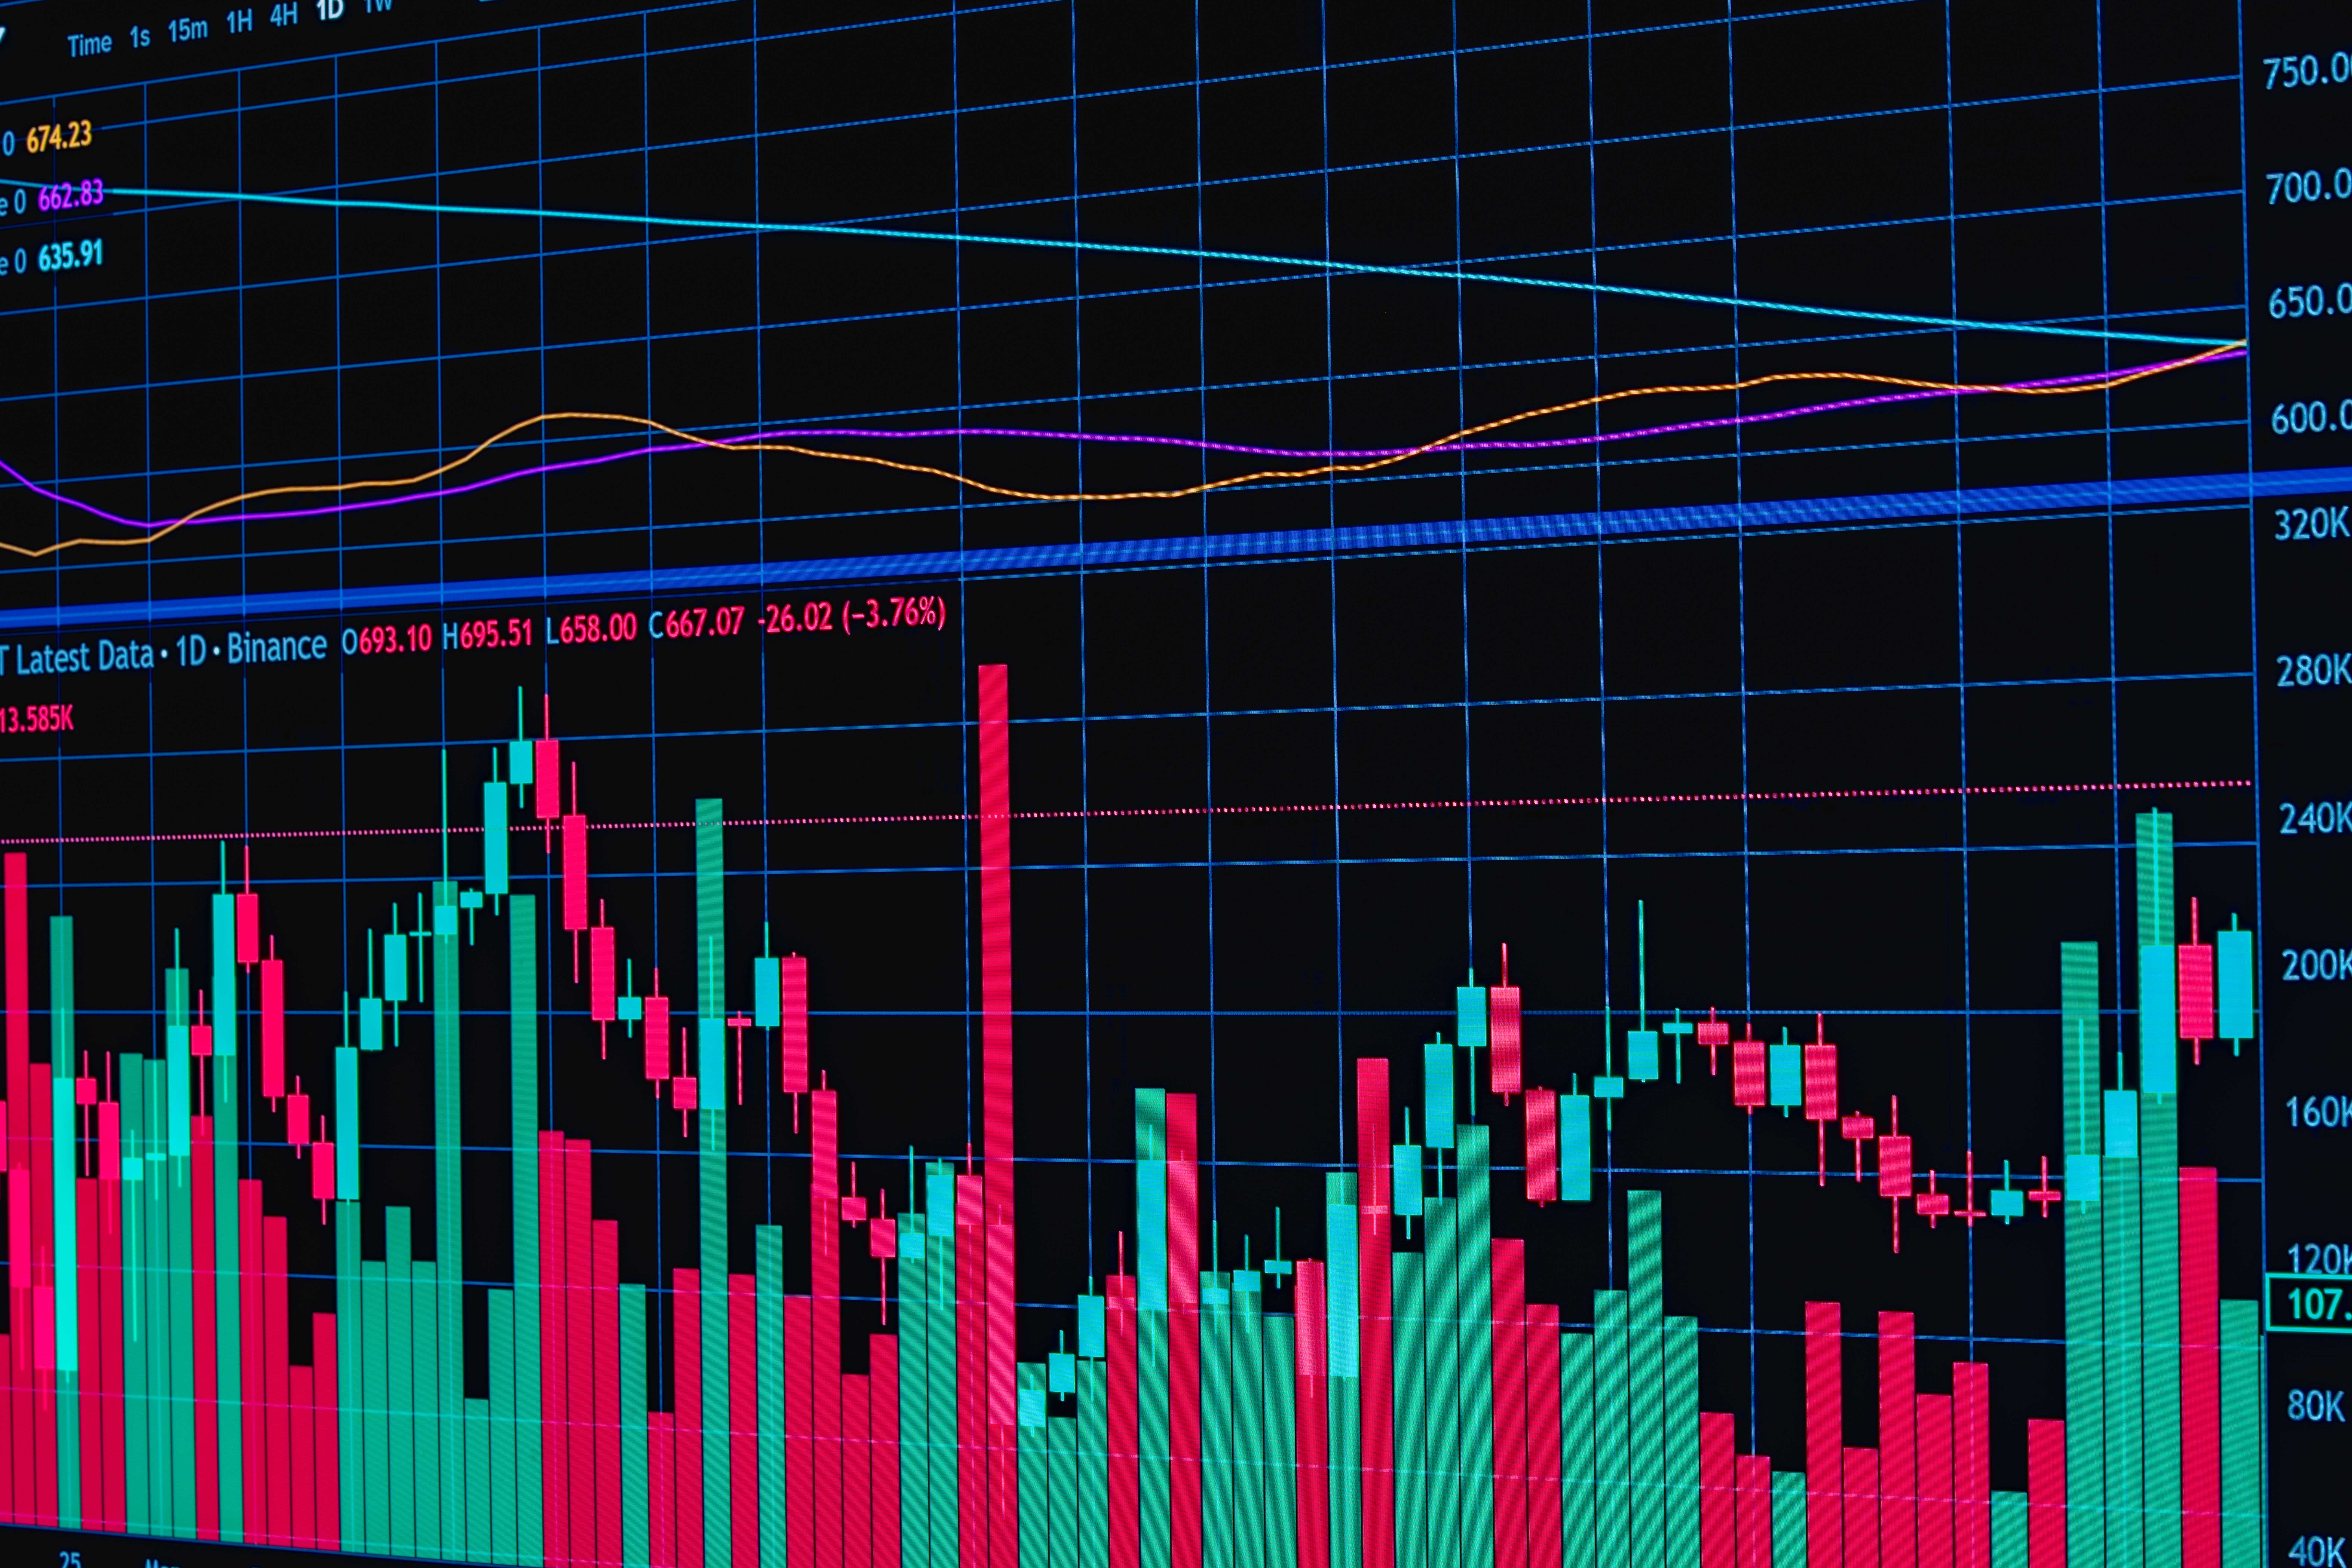
Long-run average returns are quoted constantly and are widely misread as a description of a typical year. Very few individual years resemble the average at all.
The average sits in a sparsely occupied middle
Annual equity returns are spread widely, with many strongly positive years, many negative ones and comparatively few landing close to the long-run figure.
The average is the arithmetic centre of that spread rather than its most common value. Nothing pulls individual years towards it in any given period.
Planning that assumes a steady annual outcome therefore assumes something the historical record does not contain, even where the long-run average itself is accurate.
Compounding is not addition
Returns multiply rather than add, which means the simple average of annual figures overstates what an investor actually accumulates.
A fall requires a larger proportional gain to recover, because the gain applies to a smaller base. The arithmetic is asymmetric in both directions.
The compound growth rate over a period is therefore lower than the arithmetic average of the yearly figures, and the gap widens as variation increases.
The period chosen changes the number
Averages calculated over different windows produce noticeably different figures, since a small number of extreme years exert substantial influence.
Starting and ending points matter a great deal, and a period beginning immediately after a severe fall reports a very different average from one beginning just before.
Quoted long-run figures should be read alongside the period they cover and the market they describe, since neither is standard.
Sequence matters when money moves
If no money is added or withdrawn, the order of annual returns does not affect the final amount. Once contributions or withdrawals occur, it does.
Poor returns early in a withdrawal period reduce the capital available to recover, which produces a materially different outcome from the same returns in a different order.
The average conceals this entirely, since every ordering of the same set of years produces the identical average.
Ranges communicate better than averages
Describing the range of historical outcomes conveys more than a single figure, because it makes the spread visible rather than collapsing it.
The historical record is a limited sample, and it does not define what is possible, so ranges are best treated as indicative rather than as bounds.
Nothing here supports a projection of future returns, and any figure describing the past is a description of what happened rather than an estimate of what will.
Also by Nour Haddad
- Comparing two funds properlyFunds & ETFs
- What happens if a fund or platform failsFunds & ETFs
- Thematic and sector fundsFunds & ETFs
- Factor investing, explained honestlyFunds & ETFs